Coordinación de Eléctrica y Computación, IIUNAM
Ethernet is the most widely used telecommunications technology for local area networks (LANs). Thanks to appealing characteristics such as ease of use, data support and cost effectiveness, it has also become the driving force behind the growth of larger networks, such as metropolitan area networks (MANs). Ethernet supports data rates of 10Mb/s, 100 Mb/s (Fast-Ethernet), 1 Gb/s (Gigabit-Ethernet), and 10 Gb/s. Most probably, your PC or Laptop includes a Fast or Gigabit Ethernet card that allows you to become connected to Internet. Fig. 1 shows an Ethernet switch and the corresponding optoelectronic transceiver that enables transmission along an optical fiber.
Although the aforementioned data rates are sufficient for traditional data exchange, the increase on bandwidth-need for applications such as high performance computing, virtualization, video-on-demand and massive data-centers has motivated the appearance of new specifications for the IEEE 802.3 (i.e. Ethernet) protocol at a data rate of 100 Gb/s. The IEEE Task Force in charge of defining the new technology was established in January 2008. Two and a half years later, the corresponding standard saw the light. In particular, for MAN applications, a single-mode fiber (SMF) link designed to reach up to 40 km was proposed. It is based on wavelength-division multiplexing (WDM) technology, where four wavelength channels, each at 25 Gb/s raw data rate, are combined and launched along the transmission medium. Amplification is required to overcome the attenuation of the optical fiber; as a consequence, a single semiconductor optical amplifier (SOA) is used to simultaneously pre-amplify all four channels. However, the use of these tiny but powerful amplifying devices has raised concerns on the impact of their large nonlinear response on the overall performance of the telecommunication system. Therefore, in order to set the ultimate design parameters, a numerical analysis on the nature of the SOA nonlinearities and how they affect the system as a function of channel spacing and input power was carried out by an international team led by the Instituto de Ingeniería, UNAM. The project was partially supported by Dirección General de Asuntos del Personal Académico at UNAM. The relevance of this analysis is clear from the impact that the 100GbE standard is expected to have during the next decade as one of the most widely deployed high-speed transmission commercial products.
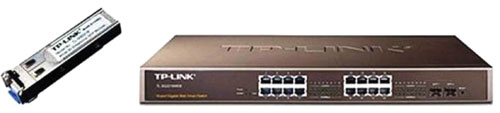
Figure 1. Ethernet switch and optoelectronic transceiver available at the Telecommunications Lab. The transceiver includes a laser diode and a photodetector.
The 40-km link under analysis is illustrated in Fig. 2. It consists of four 25.78125 Gb/s externally modulated lasers (EMLs) each composed of a DFB CW laser and an electro-absorption modulator driven by an individual electrical transmitter operating in non-return-to-zero (NRZ) format. The output power, extinction ratio and OSNR of each modulator were set to +4 dBm, 6dB and 37 dB, respectively. The fiber length is varied between 0 and 40 km. The receiver comprises an SOA and a demultiplexer that separates the individual wavelengths. Each channel is received in an optical front end, which is connected to a 25-Gb/s electrical receiver.
The main SOA nonlinearities that are anticipated to impair the transmission system performance are four-wave mixing and cross-gain modulation, which are known to cause inter-channel cross-talk, thus degrading the quality of the transmitted data. To discriminate between both nonlinear effects, two methods are used. On one hand, the channel detuning method consists in reducing four-wave mixing by detuning the probe channel from its natural position in the equally spaced channel grid, thus emphasizing the effect of cross-gain modulation. On the other hand, the periodic pattern method reduces cross-gain modulation by simultaneously operating the otherwise randomly driven four modulators with a periodic pattern composed of one mark and one space, i.e. 101010 . . . Under these circumstances, the SOA carrier density is equally modulated by all four input signals, and hence, none of the signals is affected by the particular gain modulation pattern induced by the other three. Four-wave mixing, nonetheless, prevails.
The performance of the transmission system was evaluated in channel two, where the worst transmission characteristics are expected to arise. To this end, the Quality–factor, which is defined as Q = 20log10(Q), where Q is statistically calculated as Q = (I1-I0)/(s1+s0), with I1 (I0) and s1 (s0) being the mean and standard deviation of an approximately Gaussian probability density function characterizing the detected one bits (zero bits), was utilized. The larger the Q–factor is, the better the systems behaves. The numerical analysis was carried out using a sophisticated and well-tested optical transmission system simulator mainly developed at Bell Labs in Holmdel, New Jersey, U.S.A.
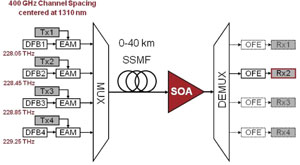
Figure 2. Setup of the 4 x 25-Gb/s optical link. Probing is carried out at channel two. Gray-shaded elements indicate electrical components.

Fig. 3 shows curves of Q-factor as a function of fiber length, where the dispersive and nonlinear contribution of the optical fiber have been artificially disabled. The curve exhibiting the lowest Q-factor values, and labeled “All”, corresponds to (typical) simulations where all nonlinearities affecting the SOA performance are present. The curve labeled “Detuned” corresponds to simulations carried out using the channel detuning method. In these simulations the effect of four-wave mixing is artificially reduced. Finally, the curve labeled “1010” was obtained by means of applying the periodic pattern method that artificially suppresses the effect of cross-gain modulation.
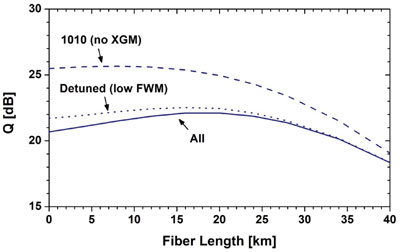
Figure 3. Calculated performance of the 100 GbE link as function of fiber length. The dotted and dashed curves were obtained using the channel detuning method (low FWM) and the periodic pattern method (no XGM), respectively.
An analysis of the graphical results shows an increase of the Q-factor (or system performance) when the channel detuning method is applied or, in other words, when the effect of four-wave mixing is reduced. This is particularly evident for short fiber lengths, where the role of fiber attenuation is less pronounced, leading to high input powers impinging into the SOA. Since optical nonlinear effects are intensity dependent, their presence is expected to be stronger for short fiber lengths, thus explaining the observed behavior. Similarly, when the effect of cross-gain modulation is suppressed via the periodic pattern method, the overall system performance becomes higher, especially for short fiber lengths. It must be noted, however, that the increase of Q-factor gained by suppressing the effect of cross-gain modulation (difference between the “All” and “1010” curves) is larger than the increase of this performance parameter when four-wave mixing is reduced (difference between the “All” and “Detuned” curves). This means that although both nonlinear effects contribute to the reduction of the Q-factor at the detected channel, it is cross-gain modulation the main optical nonlinearity that impairs the performance of the WDM system. The role of four-wave mixing is more modest, but still worth taking into account. In fact, our investigations have shown that four-wave mixing, a nonlinear effect known to become stronger as the channel spacing becomes tighter, is the main responsible for the difference in terms of system performance when the channel spacing of the WDM grid is varied. Indeed, a reduction of up to 0.8 dB in power penalty has been predicted when an 800 GHz, instead of a 400 GHz, channel spacing plan is employed.
The results here presented can be considered as a guideline to determine the most adequate channel plan to be used in the transmission system under study. Moreover, the general nature of our research allows extending our conclusions to similar WDM pre–amplified system scenarios. Our work also represents an aid for SOA designers, for they can customize devices aimed for this kind of systems, mainly by creating SOAs that exhibit reduced cross-gain modulation. Actually, we recently proposed electronic and optical solutions to mitigate the aforementioned nonlinear effects for the transmission system presented in this article. The former consists of a microprocessor-based mechanism to vary the current injected into the pre–amplifier such that its small signal gain, and corresponding saturation power, can be controlled as a function of fiber length (link attenuation), thus reducing the SOA nonlinear effects. The latter consists of the injection of a power–controlled CW beam as a fifth “un-modulated channel” to increase the saturation level of the pre–amplifier, and hence mitigate the effect of the associated nonlinearities. The former solution has proved to be a more attractive one from an economic standpoint. The results briefly presented here add on the value proposition of next generation 100Gb/s Ethernet systems.